

UV-VIS SPECTROMETRY
Spectrometry is the use of the absorption, emission, or scattering of electromagnetic radiation by atoms or molecules to qualitatively or quantitatively study the atoms or molecules, or to study physical processes. The interaction of radiation with matter can cause redirection of the radiation and/or transitions between the energy levels of the atoms or molecules. A transition from a lower level to a higher level with transfer of energy from the radiation field to the atom or molecule is called absorption. Many compounds absorb ultraviolet or visible light, and thus appear colored to the eye; the degree of color being proportional to the concentration of the compound. Measuring the concentration of an absorbing species in a sample is accomplished by applying the Beer-Lambert Law.
The Beer-Lambert law is the linear relationship between absorbance and concentration of an absorber of electromagnetic radiation. Consider a beam of monochromatic radiation of intensity I0 going through a slab of sample solution of thickness dx which contains an absorber of electromagnetic radiation at a concentration C. Absorption takes place and the intensity of the beam of radiation leaving the sample has changed by some amount proportional to the thickness of the slab and concentration of the absorbing species.
where the coefficient α is a constant of the compound at a particular wavelenght of light. The wavelength at which given amount of a material absorbs light is the absorbance maximum, or λmax. This is the wavelenght at which the absorbance of a compund in solution is measured. We can rewrite the expression as a standard differential equation,
Integrating I over its range and dx over the thickness of the container,
In order to simplify things, we replace -α with [-α/2.303] and call it ε. As you already know, the 2.303 converts the natural log (ln) into log of base ten,
where b is the thickness of the solution and the log[If / Ii] term has been set equal to the quantity we call absorbance (A). Let's take a look at a beam of radiation passing through a substance or a solution, some of the light is absorbed and the remainder transmitted through the sample.
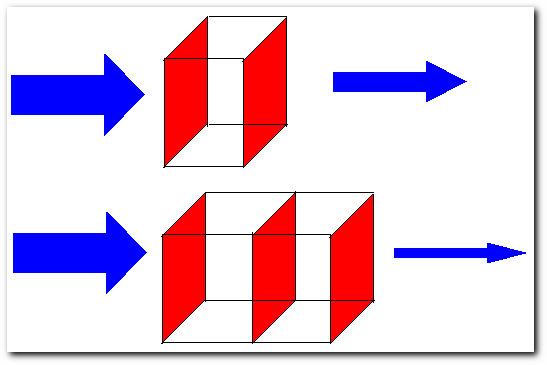
Light beams going through a solution. The thickness of the arrows are proportional the intensity of the beam.
Here, light beam number 1 (top) of intensity Ii goes through through a solution of concentration C and thickness b, the beam has an intensity smaller than Ii at the point of exit. Light beam number 2 (bottom) of the intensity Ii goes through the same solution, but this time there are two cells in the beam's path, meaning the thickness of the solution is ~2b, light beam number 2 comes out with an intensity even smaller than light beam number 1. The ratio of the intensity of the light entering the sample Ii to that exiting the sample If at a particular wavelength is defined as the transmittance (T). This is often expressed as the percent transmittance (%T), which is simply the transmittance multiplied by 100, for example: 3/4 = 75%, 1/2 = 50%, 1/4 = 25%, and so on. Thus the absorbance (A) of a sample is the negative logarithm of the transmittance.
The absorbance of a sample at a given wavelength is proportional to the absorptivity of the substance (a constant at each wavelength), the path length (the distance the light travels through the sample) and, in many instances, the concentration of the absorbing substance. In these cases the Beer-Lambert Law holds:
APPLICATION OF UV-VIS SPECTROMETRY: pKa OF AN INDICATOR
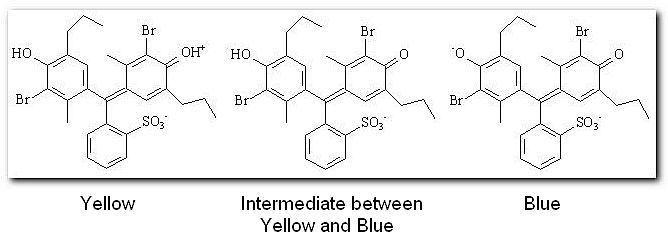
Indicators are weak acids (or bases) which have a different colour in the ionic and molecular forms. We generally represent the weak acids that are indicators by the formula HIn, meaning that this is the molecular form of the acid that is going to lose the hydrogen ion. One such indicator is bromothymol blue, in acidic solution the indicator is present in the molecular form, hence it is yellow.
<-----------low pH, pushes equilibrium to the left.
high pH, pushes equilibrium to the right. ----------->
Since the indicator has a different color when in the molecular form to when in the ionic form it seems logical to assume that the point of changing colour will be when there is 50% of both forms present. This is the point where the equilibrium between HIn and H+ + In- lies exactly at the center. Recall that -log[H+] = pH, the quantity we usually measure. So we can rewrite the dissociation constant expression,
-logKa = -log[H+] - log{[In-] / [HIn]}
-logKa = -log[H+]
pKa = pH
Note that the actual concentrations of In- and HIn have not been mentioned because we only need the ratio [In-] : [HIn]
While pH can be monitored using a pH meter, monitoring the relative concentrations of In- and HIn is not as straightforward. But the color difference of two forms indicates that there is a wavelenght λ1 where the protonated form absorbs light strongly and the deprotonated form absorbs very little. Then it is logical to assume that there is a wavelenght λ2 where the deprotonated form absorbs light strongly and the protonated form absorbs very little.
The first step of the experiment consists of scanning on solution of the protonated form (HIn) through the wavelenght range from 300 to 800 at 25 nm intervals far from λMAX and 5nm intervals near λMAX. The process is repeated with a solution of the unprotonated form (In-)
.
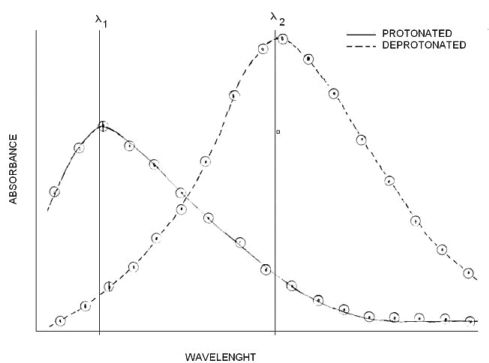
We start to see a pattern, the HIn form absorbs strongly at certain wavelenght λ1, and the In- absorbs strongly at certain wavelenght λ2. Recall that only the wavelenght is changing, the concentration is constant. This first graph provides us with an estimate of the wavelenght where each individual form of the indicator absorbs light with minimal interference from its counterpart. However, the acidic form might absorb at λ2 and the basic form might absorb at λ1. To correct for that we must subtract the minimum (background) absorbance measured at a certain wavelenght from each measurement made at that wavelenght.
Aλ2 = Aλ2 measured - Aλ2 min
Using Beer-Lambert law, the concentration of each form of the indicator can be written in terms of the absorbance at the appropriate wavelenght,
Aλ2 = ελ2 basicb [In-]
Aλ2 basic = ελ2 basicb C100%
{Aλ2 / Aλ2 basic} = [In-] / C100%
[In-]/[HIn] = {Aλ2Aλ1 acidic} / {Aλ1 Aλ2 basic}
DETERMINING pKa: GRAPHICAL DATA ANALYSIS
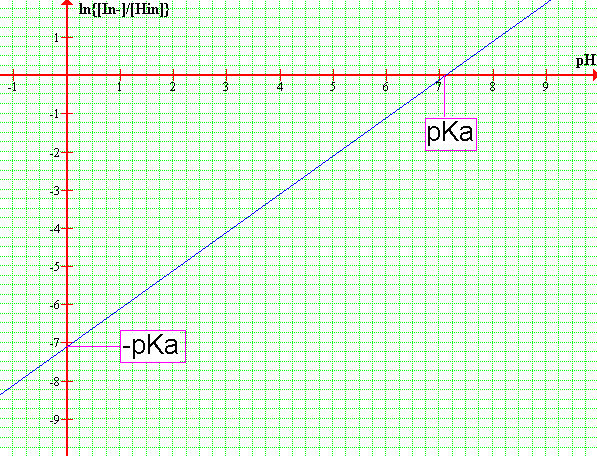
Rearrange the Henderson-Hasselbalch equation so it looks like the equation of a straight line.
log{[In-] / [HIn]} = pH - pKa
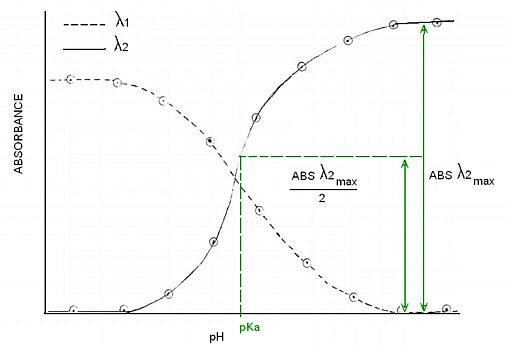
Alternatively, you can choose to determine the pKa by graphing absorbance vs. pH of the two wavelenghts. Then draw a horizontal line at ONE HALF of the absorbance difference, the line will intercept the λ1 inflection point. You might choose to use the opposite side of the graph, the procedure is the same but you would now be targetting the λ2 inflection point. This method works better if you can get many data points.
REQUIRED MATERIALS AND APPARATUS
-spectrophotometer
-at least 12 cuvets
-pH meter (or good training in buffer preparation)
-Bromothymol blue
-Conc HCl
-Conc NaOH (~4 M)
-Buffer Materials
-pipets 1.00, 5.00 mL...
EXPERIMENTAL PROCEDURE
-Clean the glassware and prepare the solutions, you will need:
i. 1 acidic solution, pH 1
ii. 1 basic solution, pH 13
iii. the remaining cuvets will have solutions with pH values that depend on the usable pH range of the indicator.
-Prepare the solutions: It is assumed that you have had decent training in chemistry lab techniques so this might sound like a trivial set of instructions.
Say you have an indicator whose usable range is between pH 3 and pH 5 and you have 12 cuvets.
[1] First you will need to dilute the indicator because the stock solution is too concentrated for the spectrophotometer. The correct dilution is the one that gives an absorbance between 0.9 and 1.0. You should make the total volume of solution and added indicator in each cuvet constant. Thus you will need to make enough solution to put 1 mL of diluted indicator in each cuvet.
[2] Put 1 mL of diluted indicator on each of the 12 cuvets.
[3] Put 1 mL of acid + 1 mL of water in cuvet number 1(one)
[4] Put 1 mL of base + 1 mL of water in cuvet number 12(twelve)
[5] Prepare 50 mL of pH 4 buffer or the recommended dilution volume if you are using a buffer capsule. Divide the buffer in half and put into separate beakers [A abd B].
[6] Put 2 mL of buffer from beaker A into cuvet number 6.
[7] Adjust the buffer to pH 3.8 by adding a few drops of acid. Put 2 mL of the buffer into cuvet number 5.
[8] Repeat the procedure for cuvets 4, 3 and 2, moving DOWN about 0.2 pH units at a time.
[9] Take the beaker with pH 4 buffer [beaker B]. Adjust the buffer to pH 4.2 by adding a few drops of base. Put 2 mL of the buffer into cuvet number 7.
[10] Repeat the procedure for cuvets 8, 9, 10 and 11, moving UP about 0.2 pH units at a time.
If available, use a pH meter to measure the pH of these solutions, otherwise assume that the buffer was prepared correctly.
-Calibrate the spectrophotometer: Fill a cell with the blank solution and place it in the cell chamber.
[1] Turn the right side knob (clockwise or counterclockwise) until the spectrophotometer reads 100 in the T scale.
[2] Remove the cell, close the cell chamber and turn the left side knob (clockwise or counterclockwise) until the spectrophotometer reads 0 in the T scale.
Repeat process as needed.
Since the spectrophotometer is being calibrated in Transmittance mode, you should record the Transmittance of each solution and then convert to Absorbance using -log[T] = A.
-Determine λMAX: Do a screening of the required amount of indicator solution using the acid and the basic solutions. The solution should contain 1.00 mL of Conc acid or base, 1.00 mL of bromothymol blue solution, and enough water to fill about 3/4 of the cuvet.
*Scan the wavelenght range from 300 to 800 using the acidic, then the basic solution. Plot the points and connect them with a smooth line to estimate λ1 and λ2.
DATA PROCESSING
-Determine and record the pH and Absorbance of the λ1 set.
-Determine and record the pH and Absorbance of the λ2 set.
-Substact the minimum absorbance from each of the solutions at the given wavelenght set. Do the same for the data set recorded at the alternate wavelenght.
-Plot absorbance as a function of wavelenght for the two datasets.
-Plot absorbance as a function of pH for the two datasets. Connect the datapoints with a smooth line and determine the pKa of the indicator. The pKa coresponds to the inflection point of each plot.
-Compute the log{[In-] / [HIn]} for each of the solutions.
-Compute the log{[In-] / [HIn]} for each of the solutions at the alternate wavelenght.
-Plot pH as a function of log{[In-] / [HIn]}. Draw the best possible straight line through the datapoints and determine the pKa of the indicator. The line intercept corresponds to -pKa or pKa depending which axis you read.
-Comment on the reliability of each method.
-Submit all graphs with your report.